Release Notes
Installation
Install on Linux
Install on Kubernetes
Pluggable Components
Upgrade
Third-Party Tools
Authentication Integration
Cluster Operations
Quick Start
DevOps
User Guide
Configration Center
Logging
Developer Guide
API Documentation
Troubleshooting
FAQ
Enable Grafana
EditKubeSphere provides multi-dimentional and multi-tenant monitoring system based on Prometheus, displaying rich metrics in its own monitoring dashboard. It also supports many flexible features to filter and rank metrics which enables maintainer to quickly track issues and bottlenecks.
If you need custom monitoring for your business applications, you can enable Grafana installation.
Note: KubeSphere will provide custom monitoring for applications in v3.0.0.
Enable Grafana before Installing KubeSphere
- You can enable Grafana in
conf/common.yamlbefore installing KubeSphere:
grafana_enabled: true # Whether to enable Grafana installation- Save it and continue to reference installation guide.
Enable Grafana after Installing KubeSphere
If you have a KubeSphere cluster installed without Grafana enabled, then you can edit the ConfigMap of ks-installer using the following command.
kubectl edit cm -n kubesphere-system ks-installerNow set grafana from False to True.
  monitoring:
     grafana:
       enabled: True  ## Whether to enable Grafana installation
Save it and exit, it will be installed automatically. You can inspect the logs of ks-installer Pod to verify the installation status, and wait for the successful result logs output.
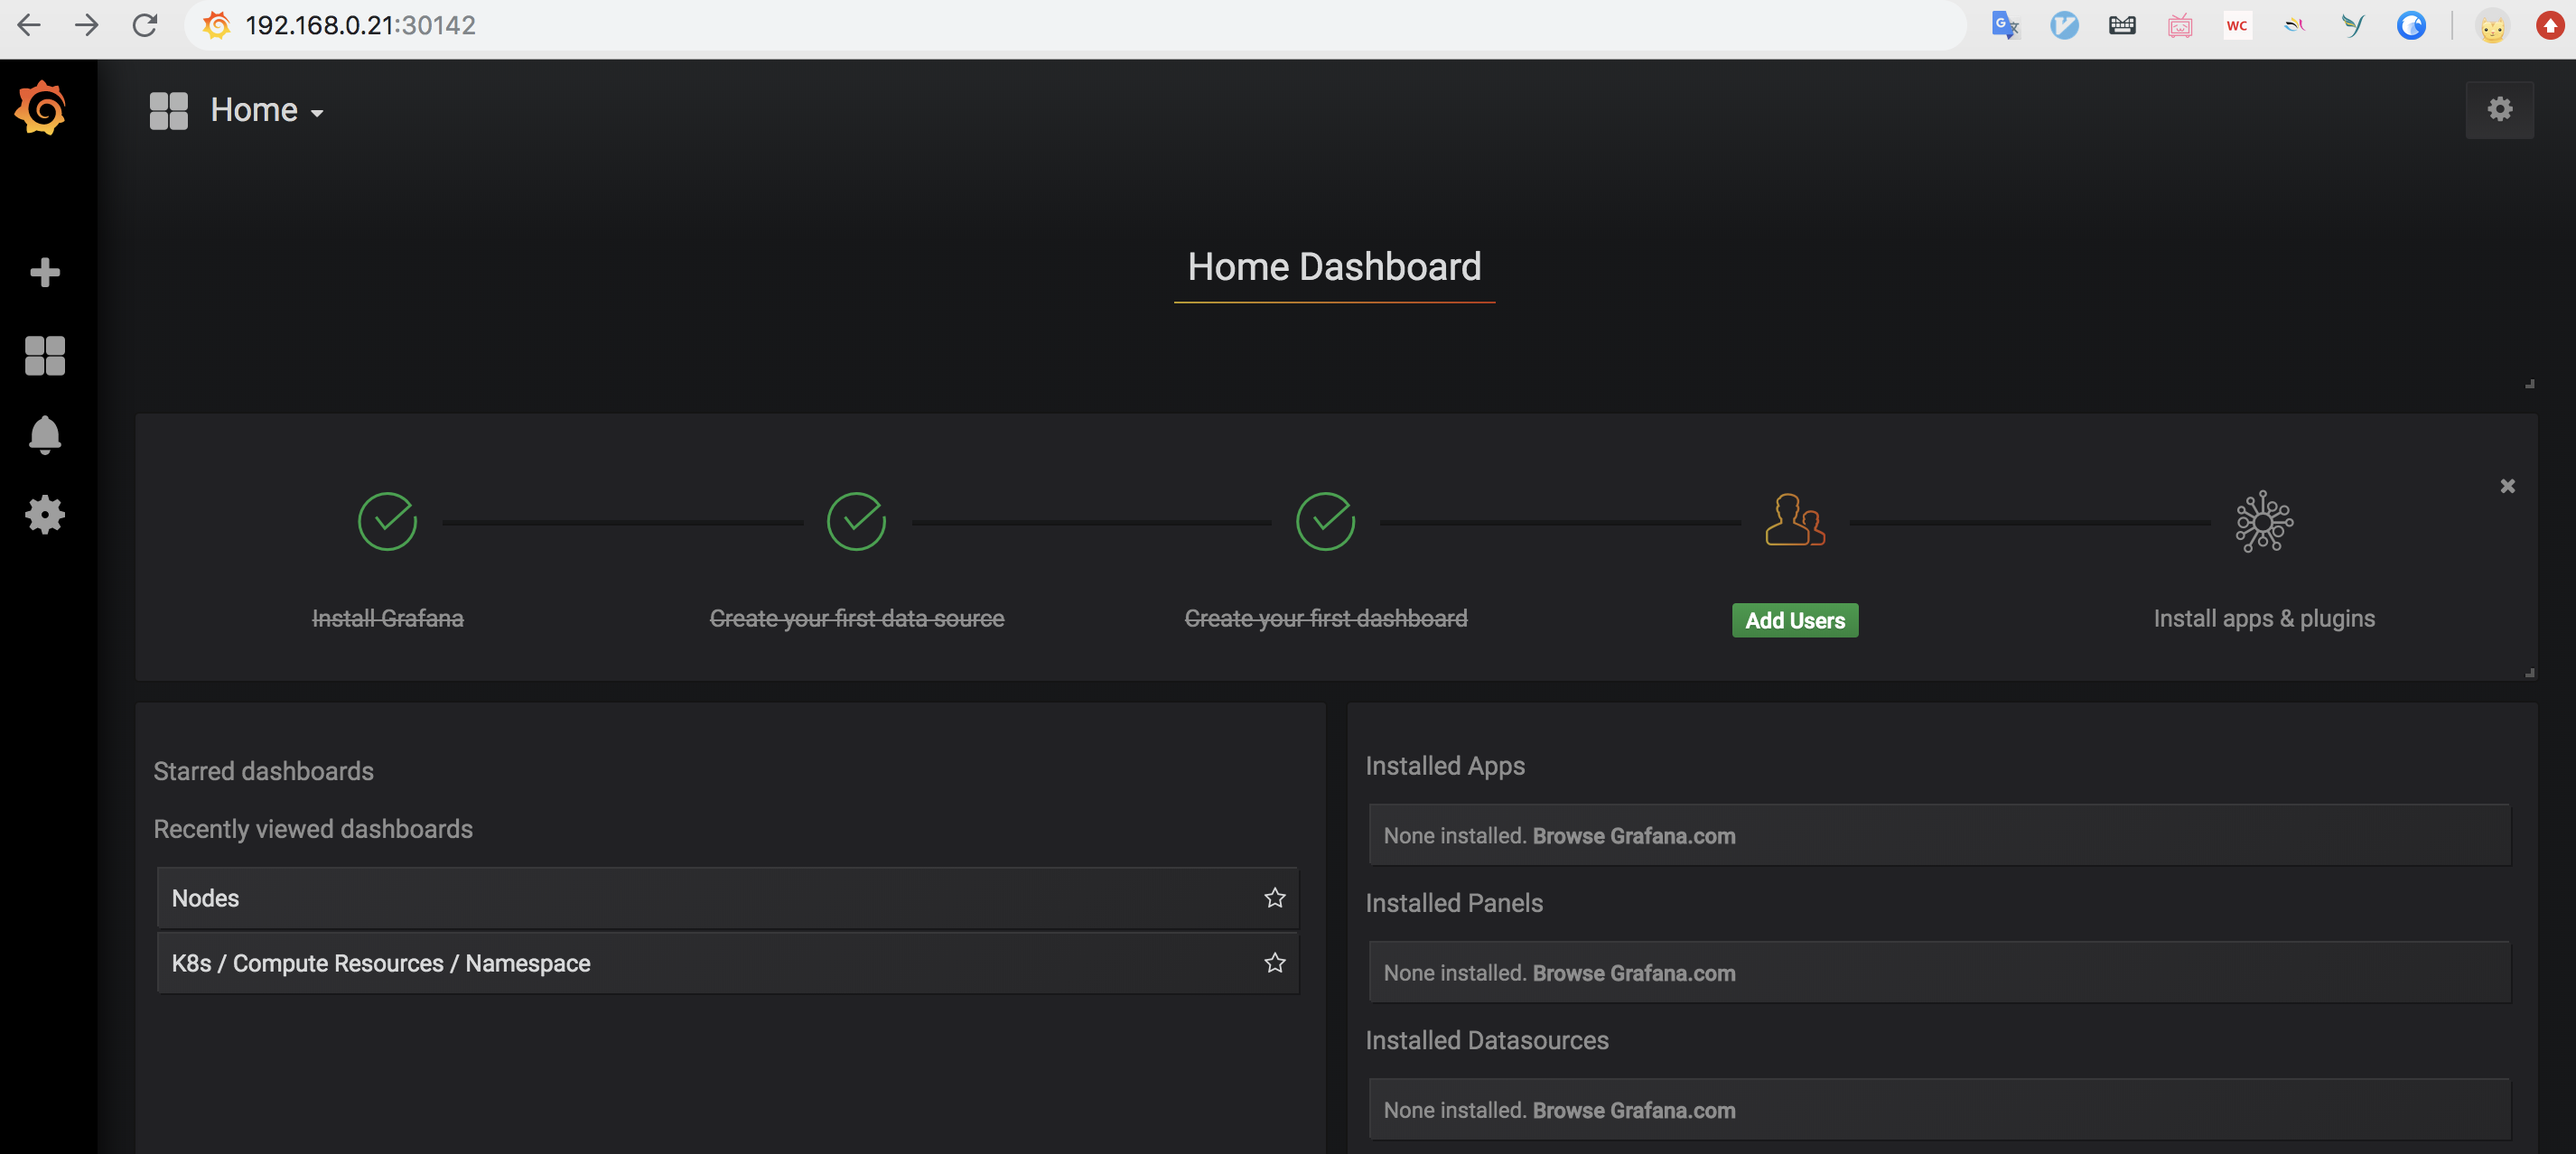
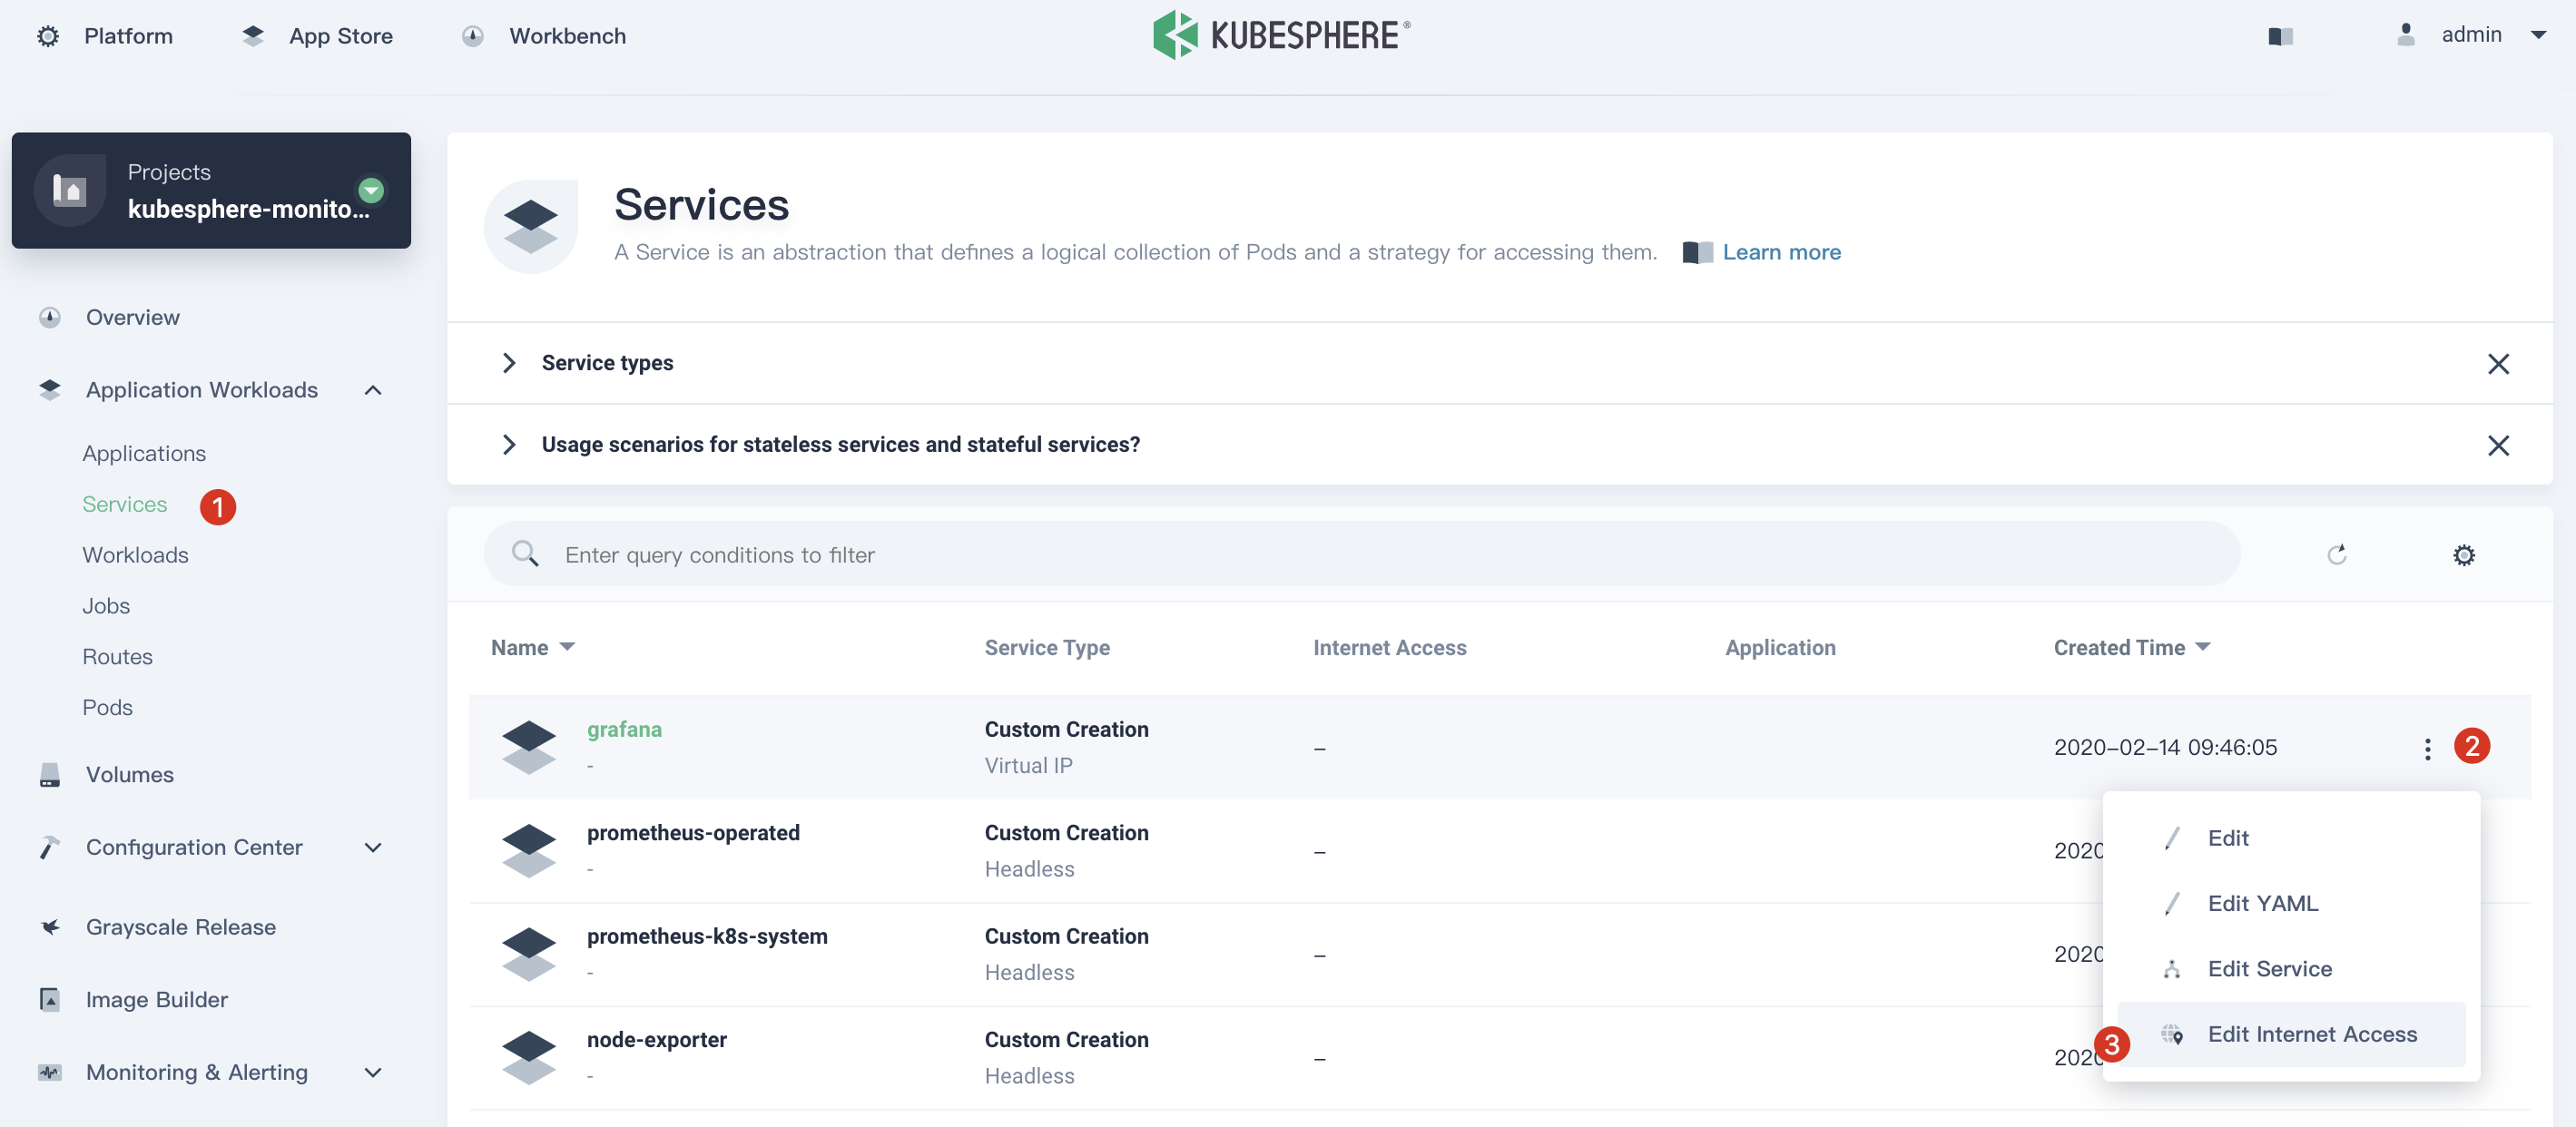
Access Grafana Dashboard
After you installed Grafana, use cluster admin account to log in KubeSphere, navigate to system-workspace → kubesphere-monitoring-system, enter grafana from the service list, and click More → Edit Internet Access, then set the service type to NodePort.
At this point, you can access Grafana using {$NodeIP}:{$NodePort} in browser. Log in Grafana with the default account admin / admin.