Release Notes
Installation
Install on Linux
Install on Kubernetes
Pluggable Components
Upgrade
Third-Party Tools
Authentication Integration
Cluster Operations
Quick Start
DevOps
User Guide
Configration Center
Logging
Developer Guide
API Documentation
Troubleshooting
FAQ
How to Access KubeSphere API
Editks-apigateway is KubeSphere's API gateway. After deploying KubeSphere or its backend, you can refer to the follow instruction to access the APIs.
Step 1: Expose ks-apigatway Service
ks-apigatway's service port can be exposed via NodePort. You can do it either through console or through command line:
- Log in to KubeSphere using the
adminaccount, open Web Kubectl in the「Toolbox」in the bottom right corner, and execute the following command.
$ kubectl -n kubesphere-system patch svc ks-apigateway -p '{"spec":{"type":"NodePort"}}'
service/ks-apigateway patched- Use the following command to view the generated port number. Here is
31078.
$ kubectl -n kubesphere-system get svc ks-apigateway -o jsonpath='{.spec.ports[0].nodePort}'
31078
Step 2: Get Token
All the KubeSphere's APIs should pass the JWT Bearer token authentication. Before invoking API, you need to get access_token from /kapis/iam.kubesphere.io/v1alpha2/login port. Then add the Authorization: Bearer <access_token> into the immediate next requests.
Execute the following commands where 192.168.0.20 is the cluster node IP and 31078 is the ks-apigatway service NodePort exposed in the previous step.
Note: Please replace the IP and NodePort with yours.
Request example
curl -X POST \
  http://192.168.0.20:31078/kapis/iam.kubesphere.io/v1alpha2/login \
  -H 'Content-Type: application/json' \
  -d '{
  "username":"admin",
  "password":"P@88w0rd"
}'
Response
{
 "access_token": "eyJhbGciOiJIUzI1NiIsInR5cCI6IkpXVCJ9.eyJlbWFpbCI6ImFkbWluQGt1YmVzcGhlcmUuaW8iLCJpYXQiOjE1NzM3Mjg4MDMsInVzZXJuYW1lIjoiYWRtaW4ifQ.uK1KoK1c8MFkm8KnyORFTju31OsZ1ajtGNZQnUS1qk8"
}
Step 3: Access KubeSphere API
After the access token retrieved, the KubeSphere API can be invoked in a user-defined request function, please note attach the request header Authorization: Bearer <access_token> in each API request. For further details, please refer to API Guide.
For instance, the following request is to get all components status.
curl -X GET \
  http://192.168.0.20:31078/api/v1/componentstatuses \
  -H 'Authorization: Bearer eyJhbGciOiJIUzI1NiIsInR5cCI6IkpXVCJ9.eyJlbWFpbCI6ImFkbWluQGt1YmVzcGhlcmUuaW8iLCJpYXQiOjE1NzM3Mjg4MDMsInVzZXJuYW1lIjoiYWRtaW4ifQ.uK1KoK1c8MFkm8KnyORFTju31OsZ1ajtGNZQnUS1qk8'
It responses as follows:
{
"kind": "ComponentStatusList",
"apiVersion": "v1",
"metadata": {
"selfLink": "/api/v1/componentstatuses"
},
"items": [
{
"metadata": {
"name": "scheduler",
"selfLink": "/api/v1/componentstatuses/scheduler",
"creationTimestamp": null
},
"conditions": [
{
"type": "Healthy",
"status": "True",
"message": "ok"
}
]
},
{
"metadata": {
"name": "controller-manager",
"selfLink": "/api/v1/componentstatuses/controller-manager",
"creationTimestamp": null
},
"conditions": [
{
"type": "Healthy",
"status": "True",
"message": "ok"
}
]
},
{
"metadata": {
"name": "etcd-1",
"selfLink": "/api/v1/componentstatuses/etcd-1",
"creationTimestamp": null
},
"conditions": [
{
"type": "Healthy",
"status": "True",
"message": "{\"health\": \"true\"}"
}
]
},
{
"metadata": {
"name": "etcd-0",
"selfLink": "/api/v1/componentstatuses/etcd-0",
"creationTimestamp": null
},
"conditions": [
{
"type": "Healthy",
"status": "True",
"message": "{\"health\": \"true\"}"
}
]
},
{
"metadata": {
"name": "etcd-2",
"selfLink": "/api/v1/componentstatuses/etcd-2",
"creationTimestamp": null
},
"conditions": [
{
"type": "Healthy",
"status": "True",
"message": "{\"health\": \"true\"}"
}
]
}
]
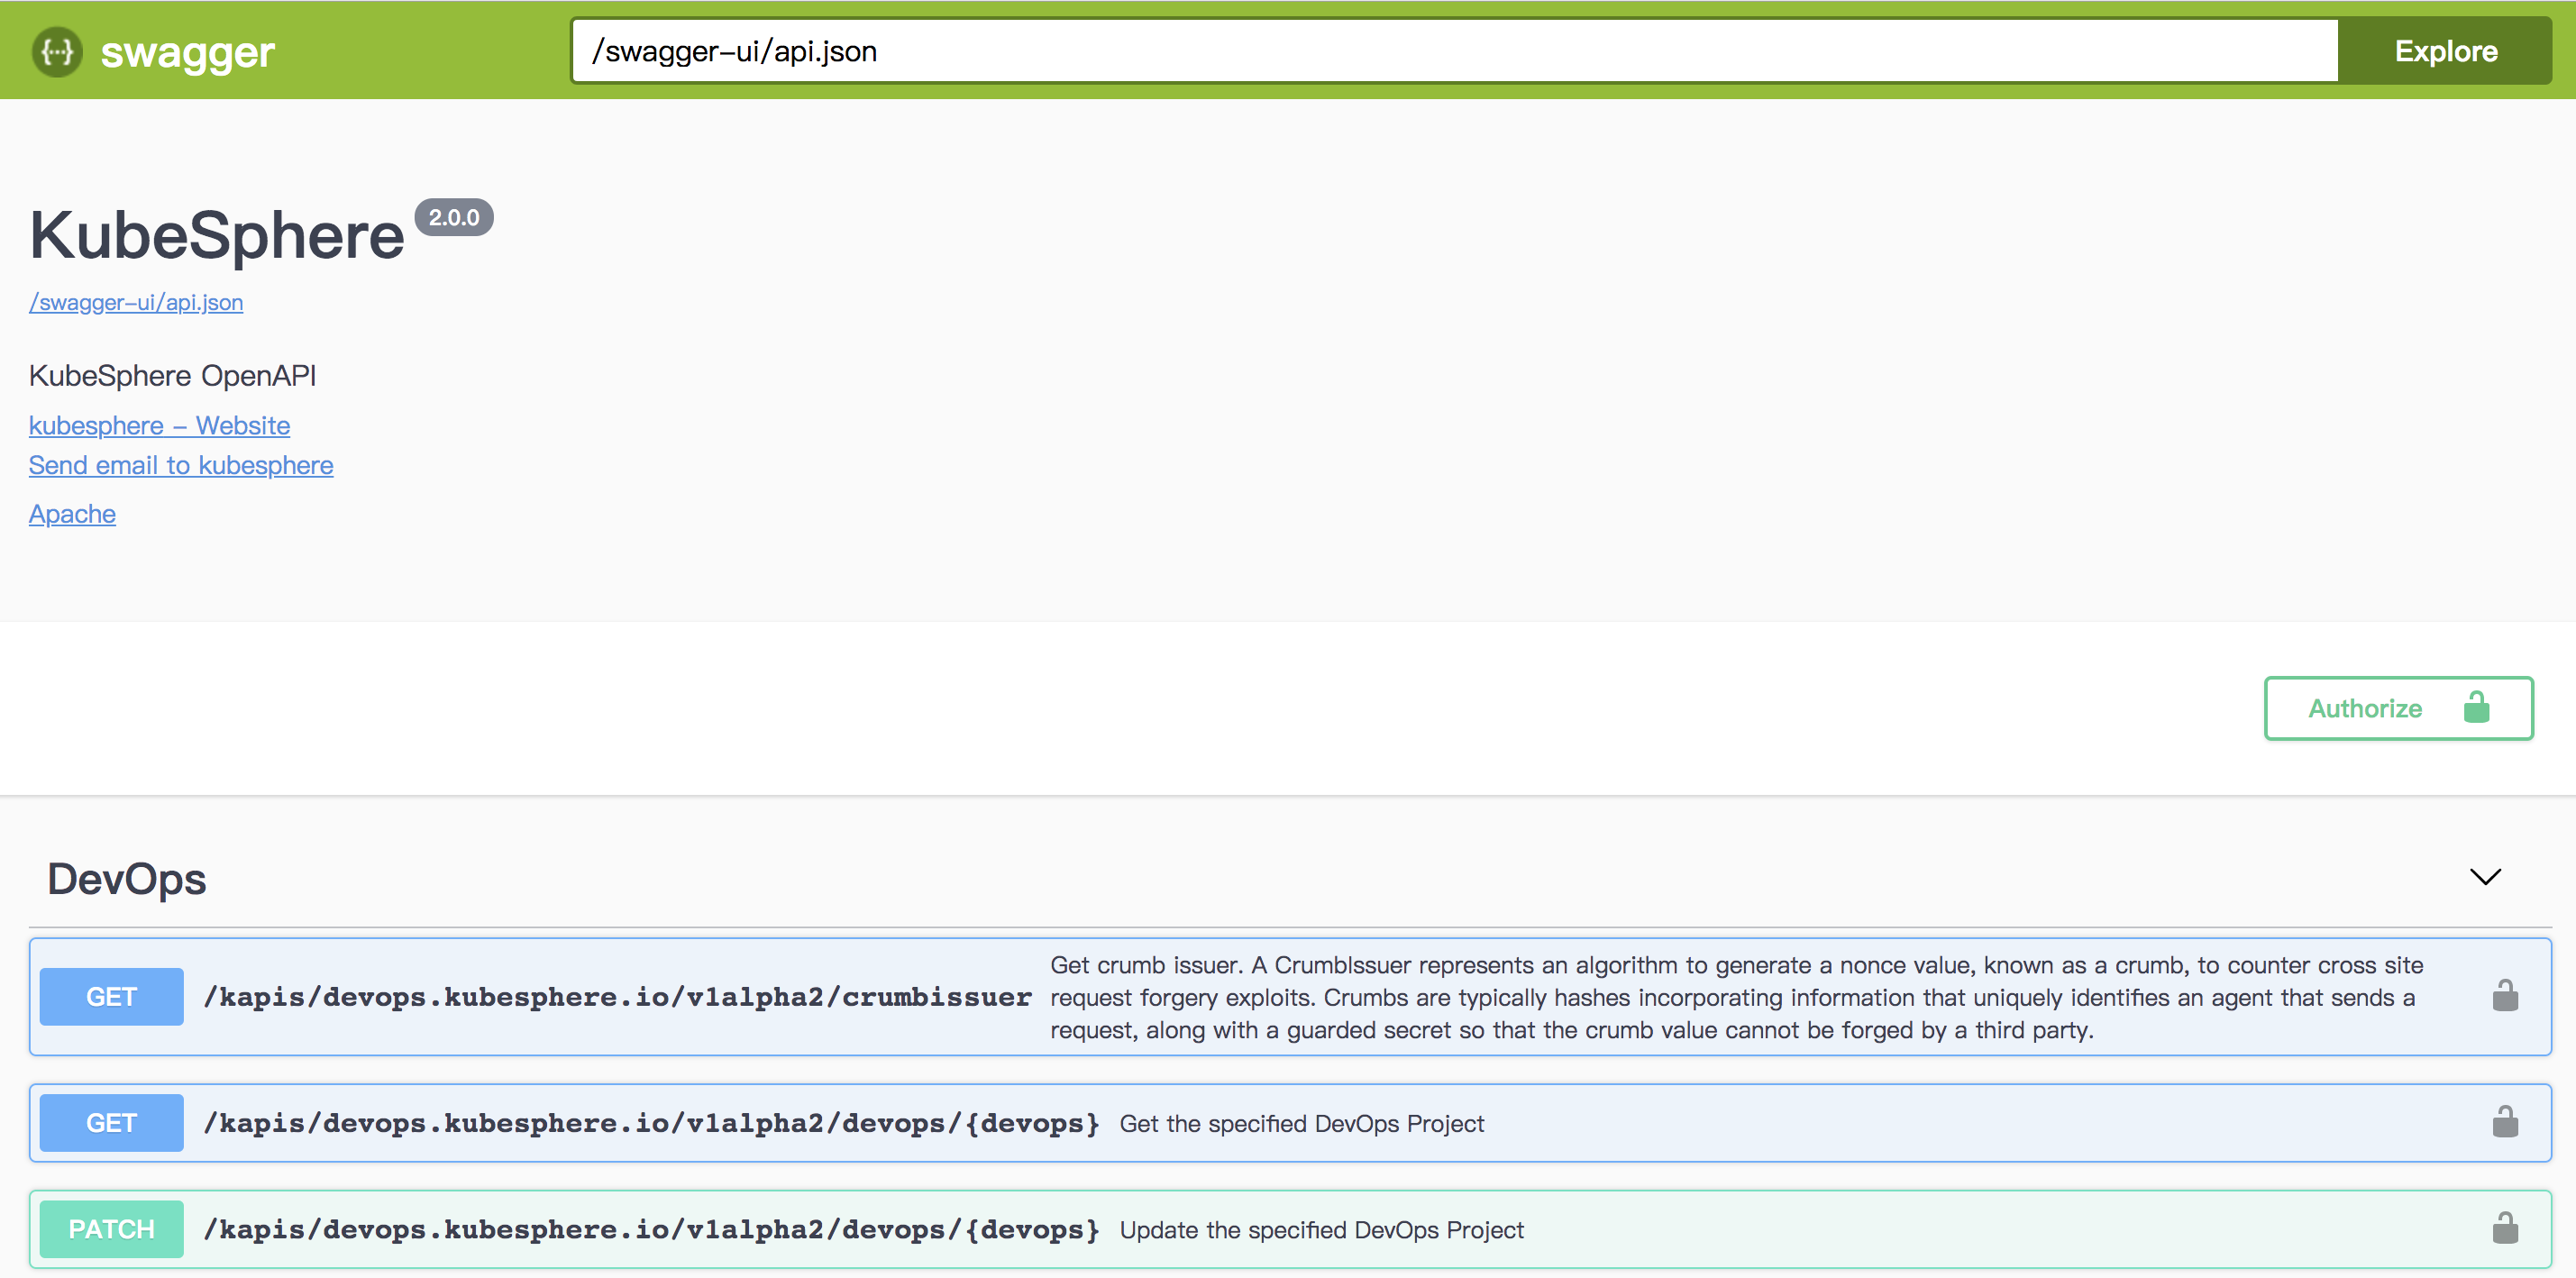
}How to Access Swagger UI
KubeSphere's API can be previewed by accessing the URL http://IP:NodePort/swagger-ui to visit Swagger UI, for instance, this example is http://192.168.0.20:31078/swagger-ui/.