v2.1
v2.0
v1.0
  1. Release Notes
    1. Release Notes - 2.1.1Latest
    1. Release Notes - 2.1.0
    1. Release Notes - 2.0.2
    1. Release Notes - 2.0.1
    1. Release Notes - 2.0.0
  1. Introduction
    1. Introduction
    1. Features
    1. Architecture
    1. Advantages
    1. Glossary
  1. Installation
    1. Introduction
      1. Intro
      2. Port Requirements
      3. Kubernetes Cluster Configuration
    1. Install on Linux
      1. All-in-One Installation
      2. Multi-Node Installation
      3. High Availability Configuration
      4. Air Gapped Installation
      5. StorageClass Configuration
      6. Enable All Components
    1. Install on Kubernetes
      1. Prerequisites
      2. Install on K8s
      3. Air Gapped Installation
      4. Install on GKE
    1. Pluggable Components
      1. Pluggable Components
      2. Enable Application Store
      3. Enable DevOps System
      4. Enable Logging System
      5. Enable Service Mesh
      6. Enable Alerting and Notification
      7. Enable Metrics-server for HPA
      8. Verify Components Installation
    1. Upgrade
      1. Overview
      2. All-in-One
      3. Multi-node
    1. Third-Party Tools
      1. Configure Harbor
      2. Access Built-in SonarQube and Jenkins
      3. Enable built-in Grafana Installation
      4. Load Balancer plugin in Bare Metal - Porter
    1. Authentication Integration
      1. Configure LDAP/AD
    1. Cluster Operations
      1. Add or Cordon Nodes
      2. High Risk Operations
      3. Uninstall KubeSphere
  1. Quick Start
    1. 1. Getting Started with Multi-tenancy
    1. 2. Expose your App Using Ingress
    1. 3. Compose and Deploy Wordpress to K8s
    1. 4. Deploy Grafana Using App Template
    1. 5. Job to Compute π to 2000 Places
    1. 6. Create Horizontal Pod Autoscaler
    1. 7. S2I: Publish your App without Dockerfile
    1. 8. B2I: Publish Artifacts to Kubernete
    1. 9. CI/CD based on Spring Boot Project
    1. 10. Jenkinsfile-free Pipeline with Graphical Editing Panel
    1. 11. Canary Release of Bookinfo App
    1. 12. Canary Release based on Ingress-Nginx
    1. 13. Application Store
  1. DevOps
    1. Pipeline
    1. Create SonarQube Token
    1. Credentials
    1. Set CI Node for Dependency Cache
    1. Set Email Server for KubeSphere Pipeline
  1. User Guide
    1. Configration Center
      1. Secrets
      2. ConfigMap
      3. Configure Image Registry
  1. Logging
    1. Log Query
  1. Developer Guide
    1. Introduction to S2I
    1. Custom S2I Template
  1. API Documentation
    1. API Documentation
    1. How to Access KubeSphere API
  1. Troubleshooting
    1. Troubleshooting Guide for Installation
  1. FAQ
    1. Telemetry
KubeSphere®️ 2020 All Rights Reserved.

Service Components

Edit

The service components panel provides health status monitoring of various service components in the cluster, which can help cluster administrators to monitor the status of the cluster and locate problems timely.

Inspect the Service Component

Sign it with cluster admin, navigate to Platform Management → Service Components, then you can see the service components page.

service components

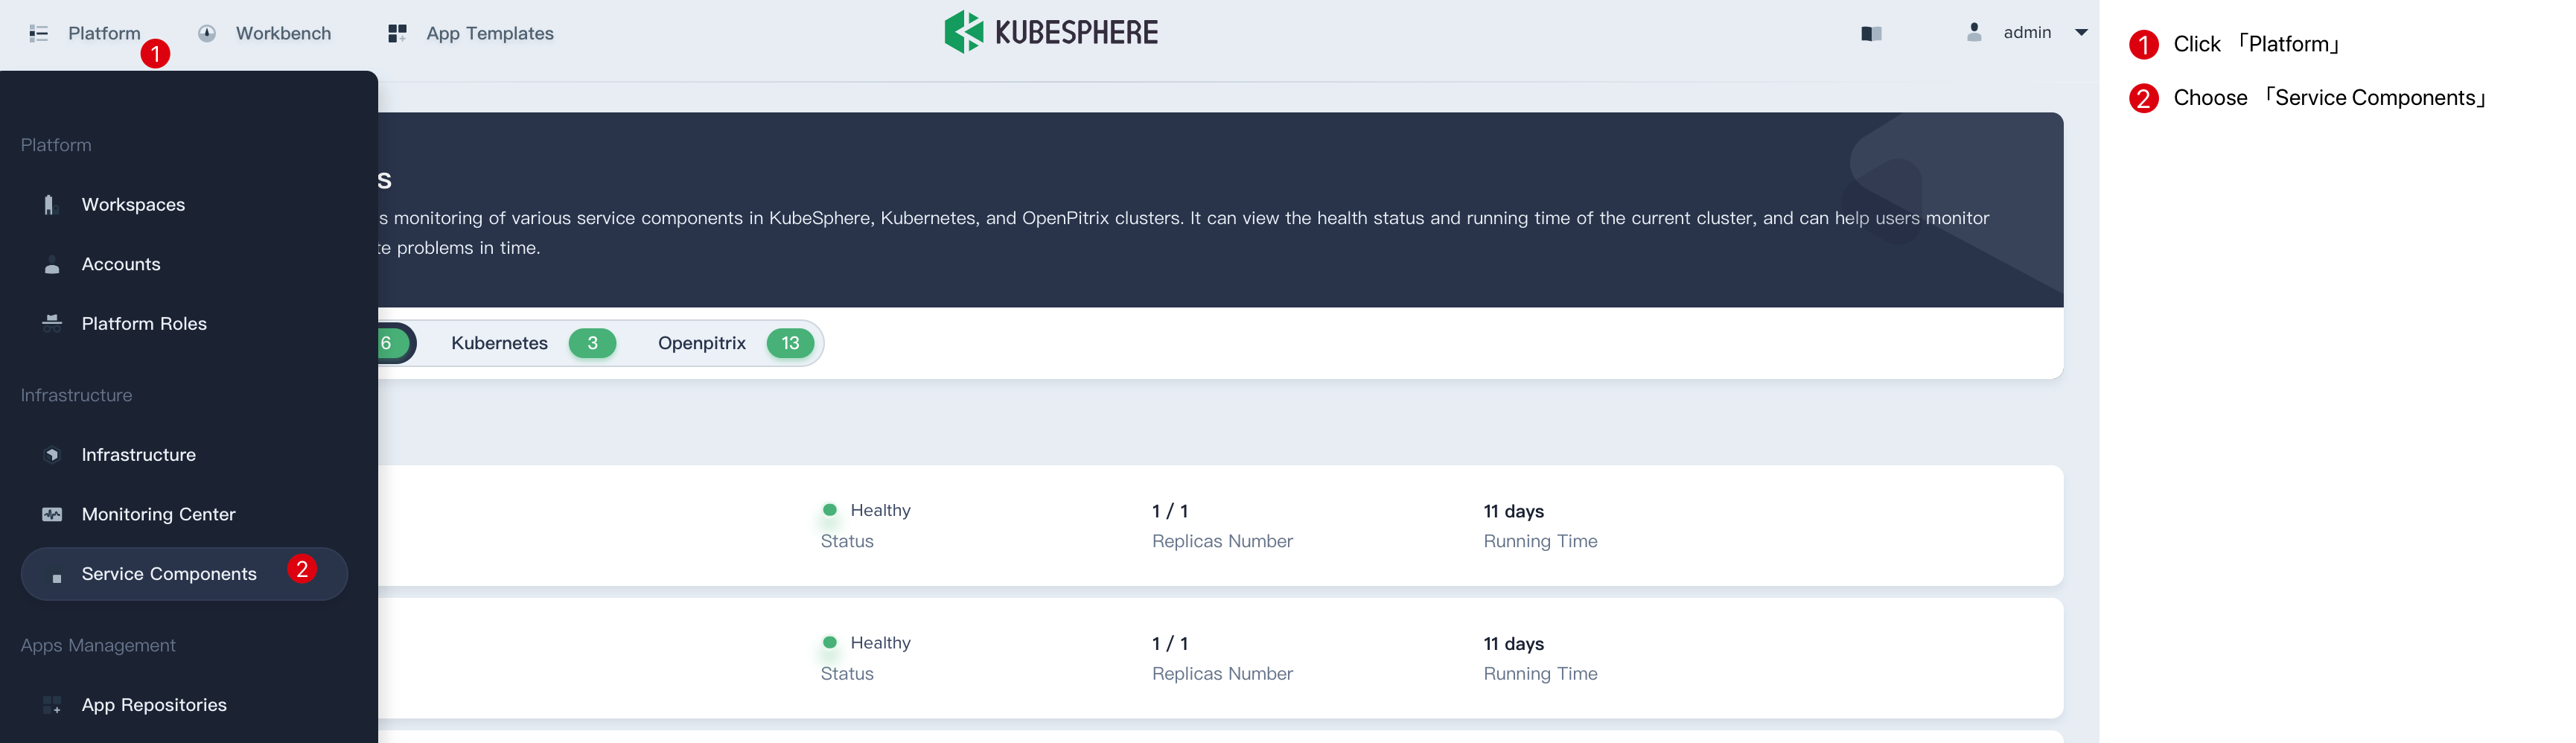
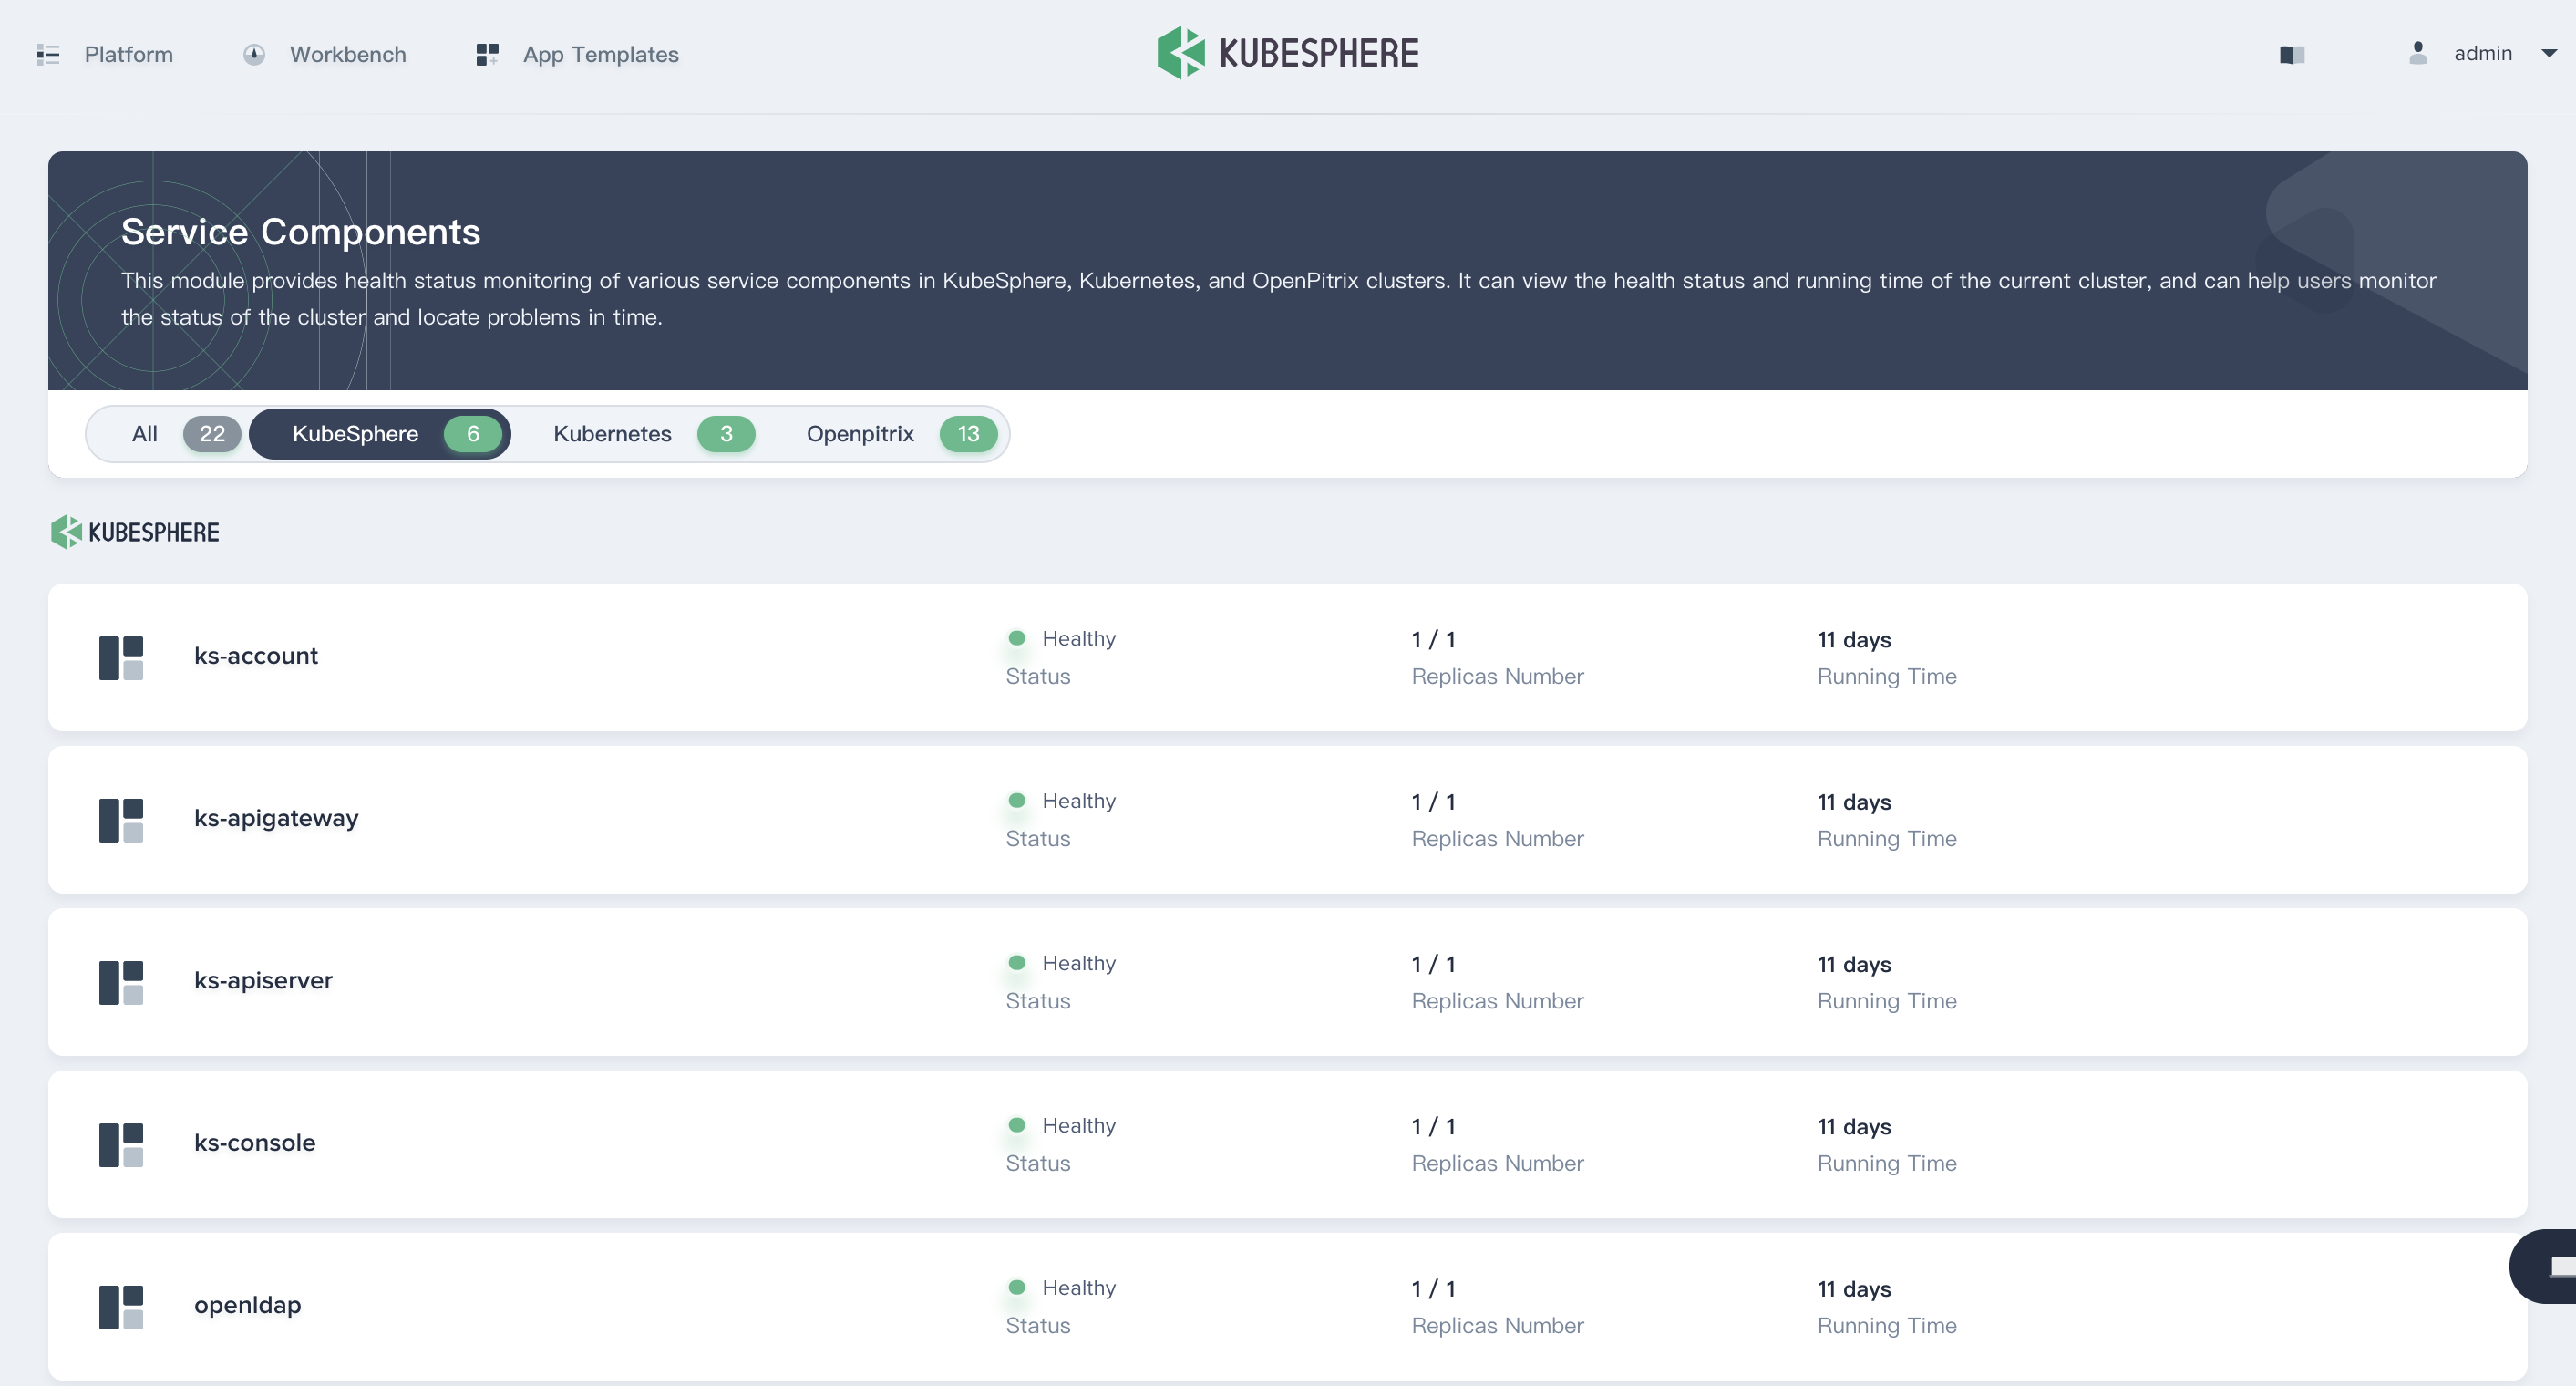
As a cluster administrator, you can view all the service components of KubeSphere, Kubernetes and OpenPitrix.

service components

The role of service component

The service component page supports view the current health status of the cluster, when there is an exception in the cluster, the cluster admin can quickly inspect if there is an exception in any of the service components.

For example, when the application is deployed with the application template, and the application is not successfully deployed, the cluster admin can check whether there is an exception in the component of Openpitrix, then proceed to locate the problem and inspect the logs and events, finally fix it according to the abnormal component. Each tab can also shows the number of exception components.